PRTG monitors every aspect of your IT infrastructure

Monitor all systems, devices, traffic and applications of your IT infrastructure. Everything you need is contained in PRTG, no additional downloads are required.

Contact Us

PRTG monitors every aspect of your IT infrastructure

Monitor all systems, devices, traffic and applications of your IT infrastructure. Everything you need is contained in PRTG, no additional downloads are required.

Contact Us

What can PRTG do for you?

PRTG monitors your entire IT infrastructure

Traffic, packets, applications, bandwidth, cloud services, databases, virtual environments, uptime, ports, IPs, hardware, security, web services, disk usage, physical environments, IoT devices and almost everything you can imagine.

PRTG supports most technologies

SNMP (all versions), Flow technologies (i.e. NetFlow, jFlow, sFlow), SSH, WMI, Ping, and SQL. Powerful API (Python, EXE, DLL, PowerShell, VB, Batch Scripting, REST) to integrate everything else. See all PRTG features

PRTG form monitoring for every platform

Download for Windows and hosted version available. Monitoring via AJAX Web Interface or Desktop Client.

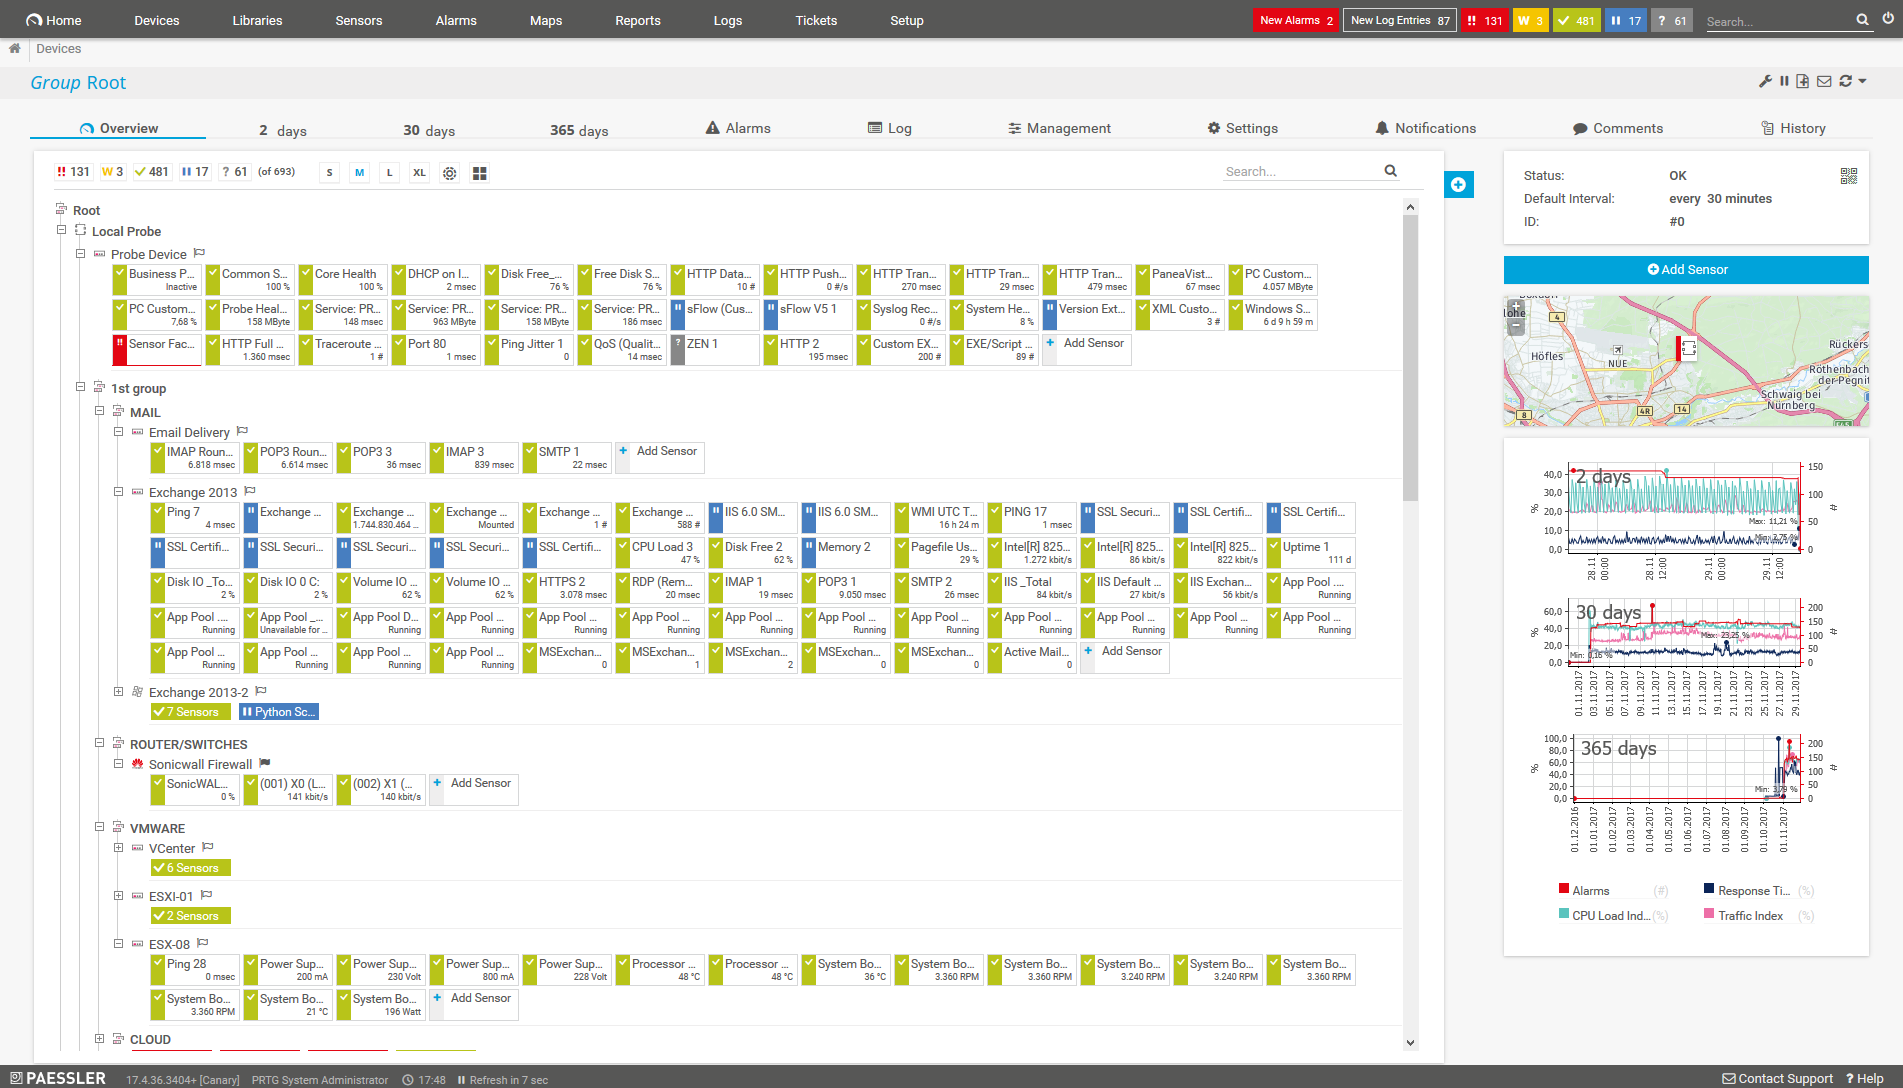
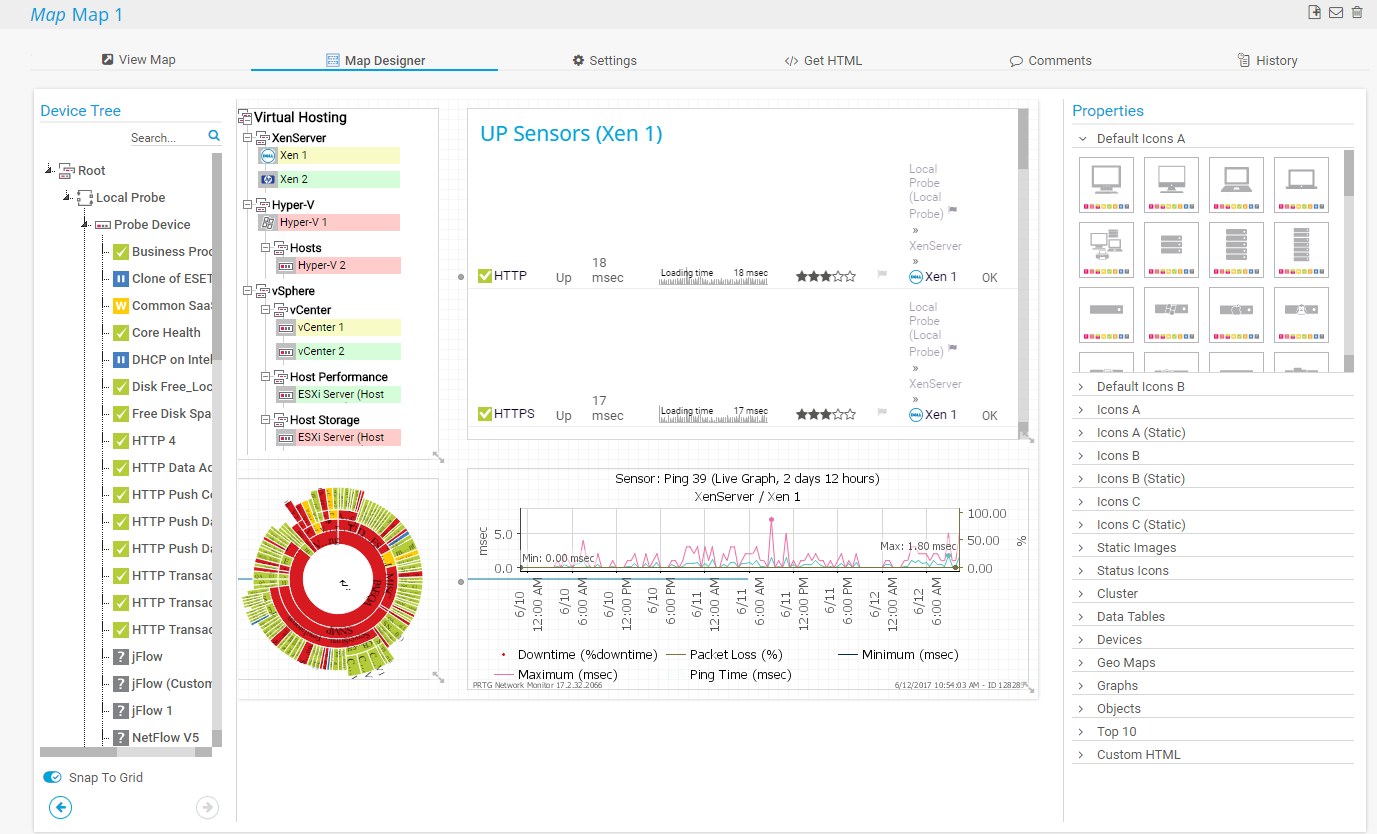
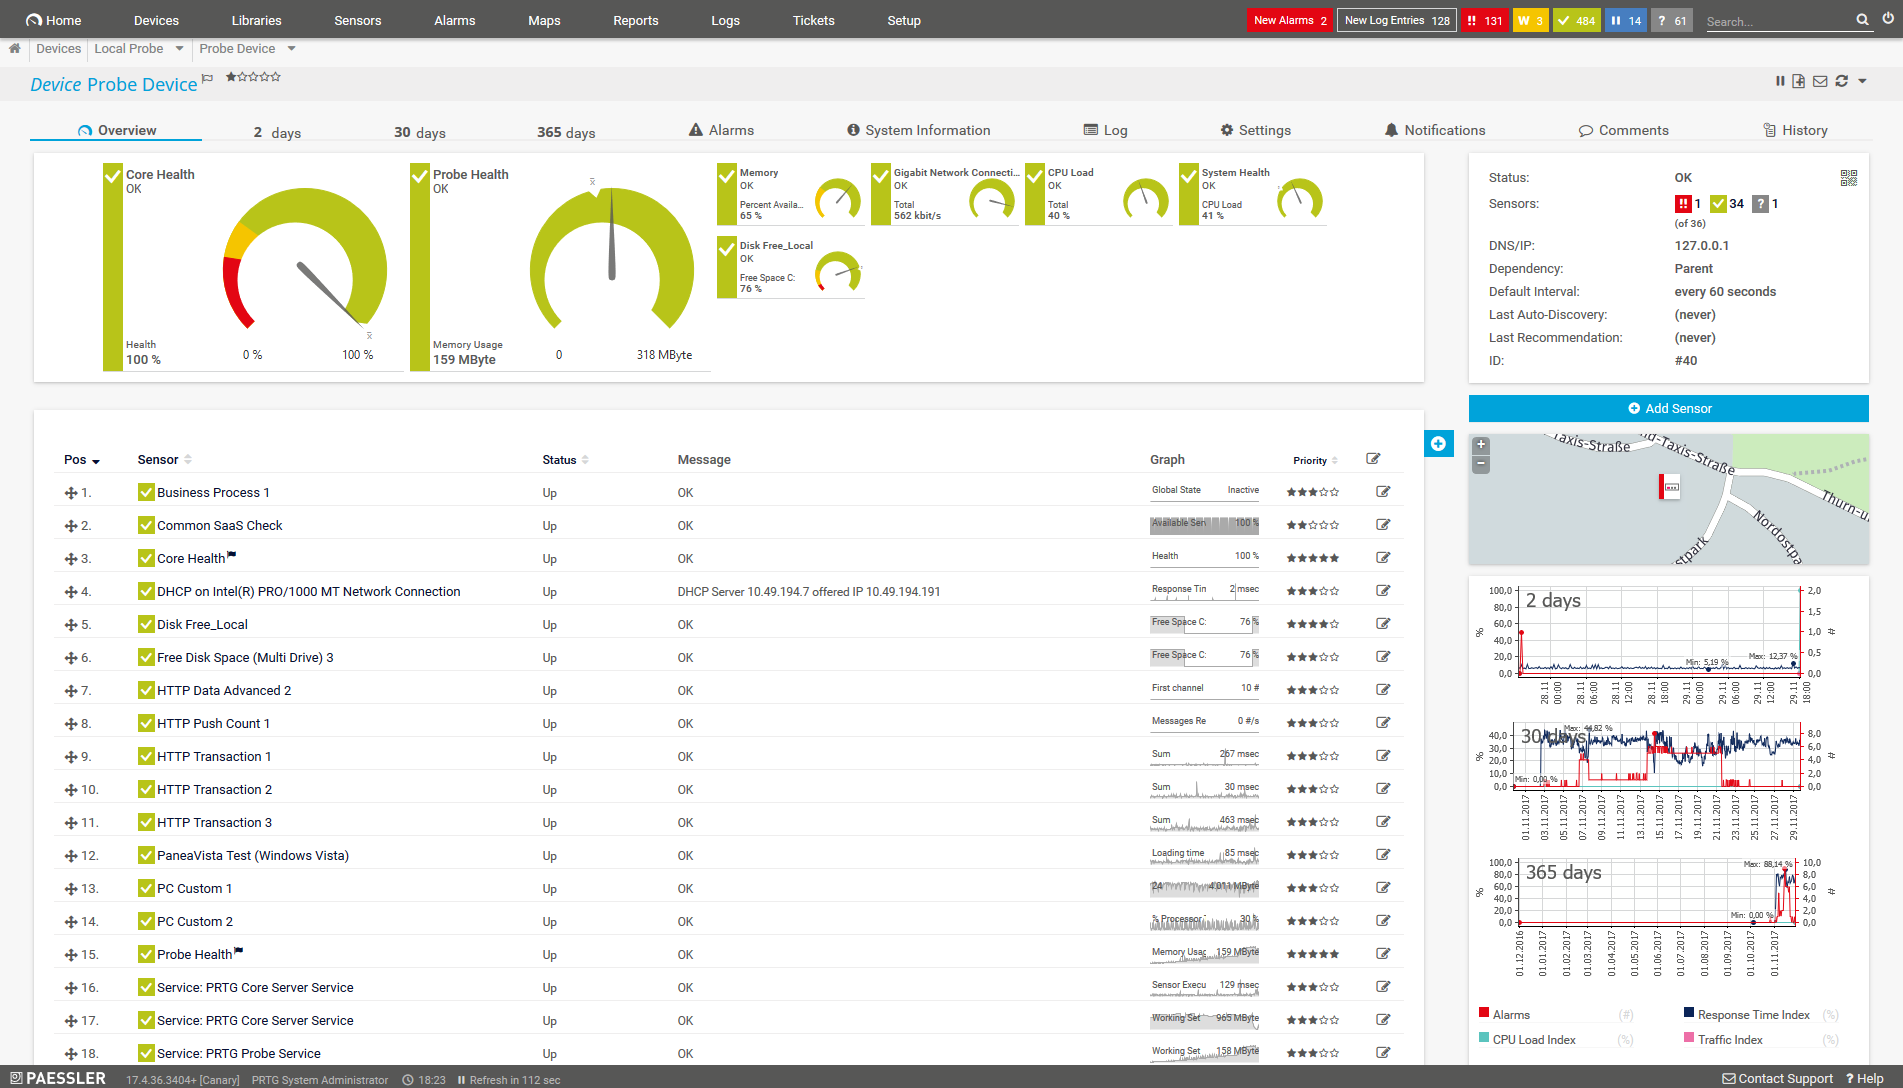
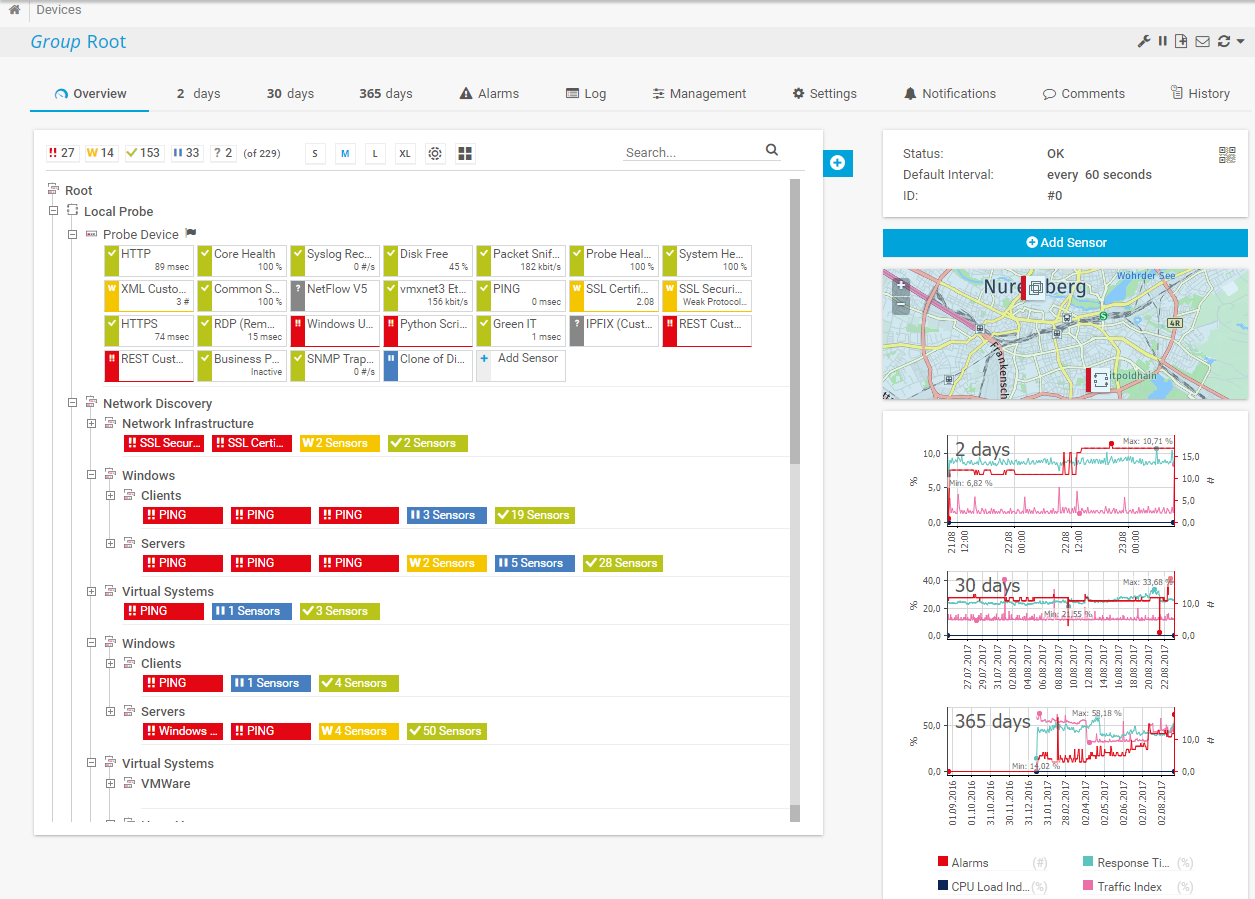
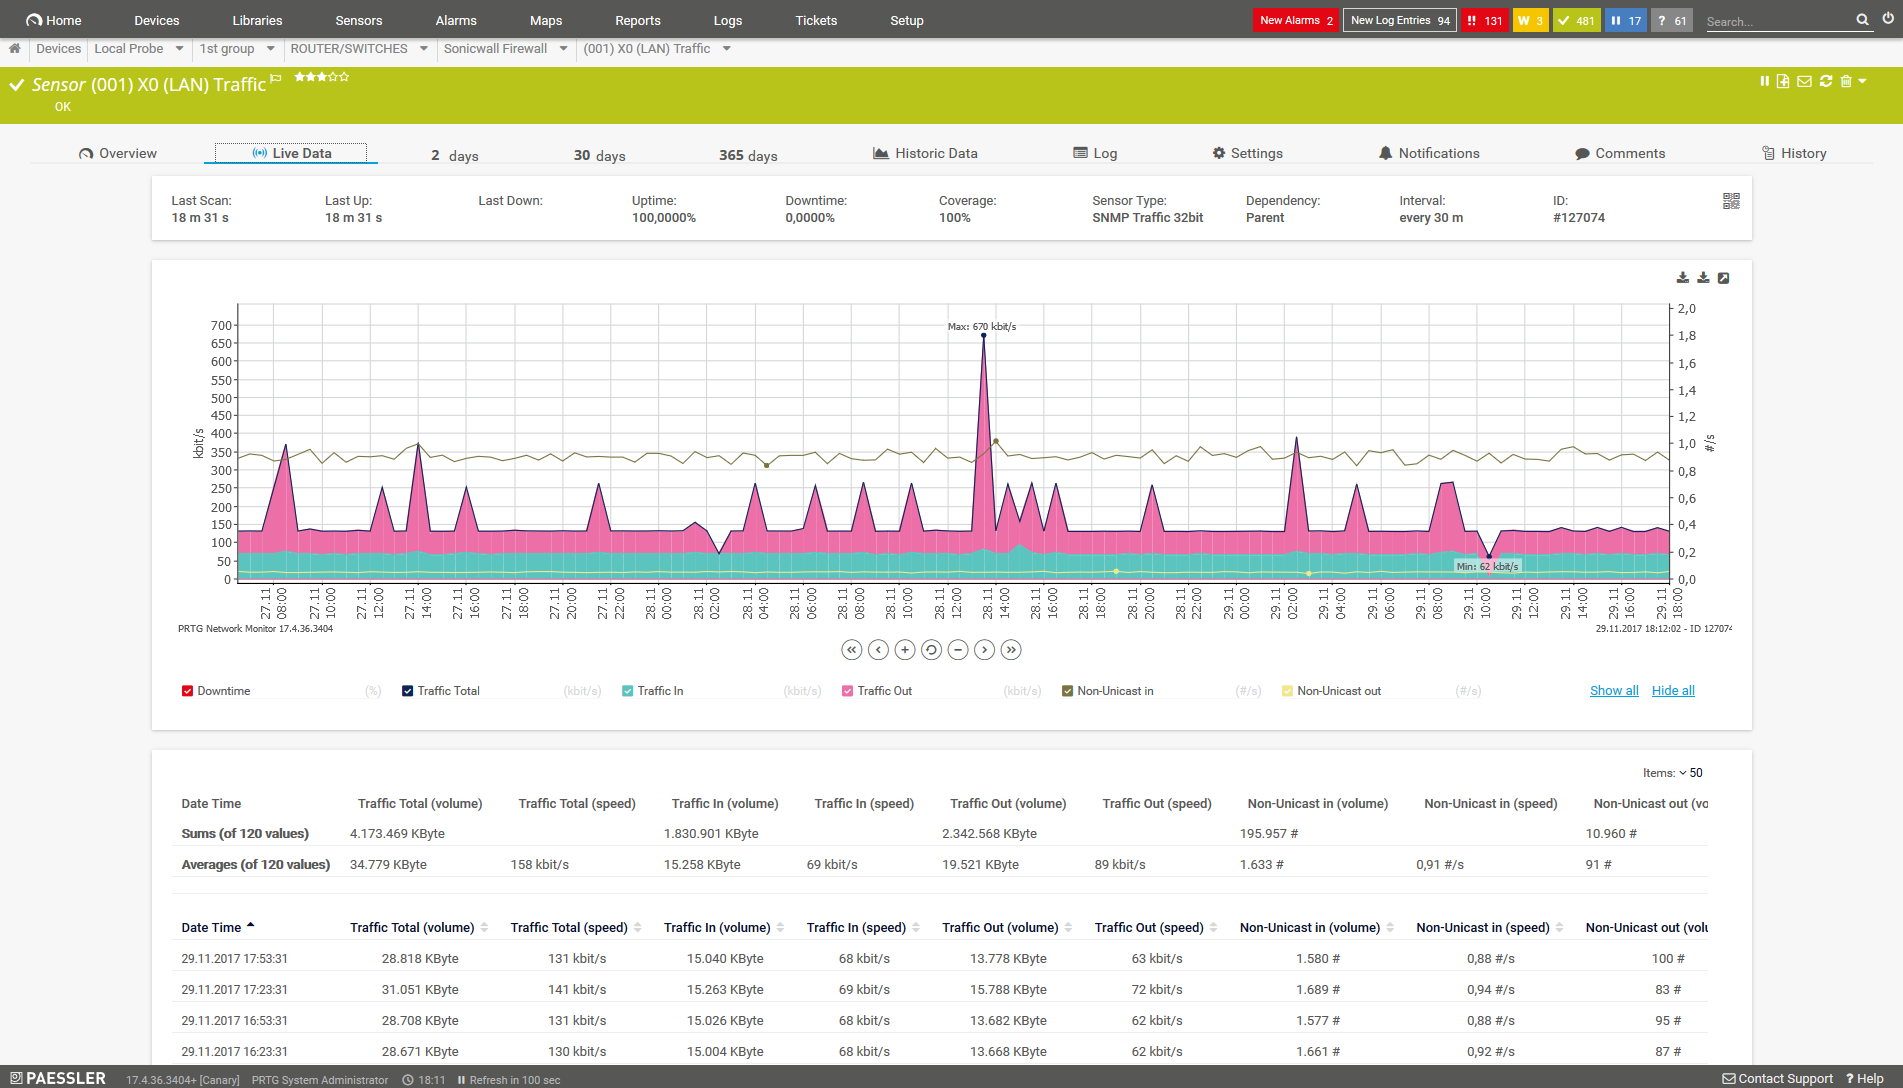
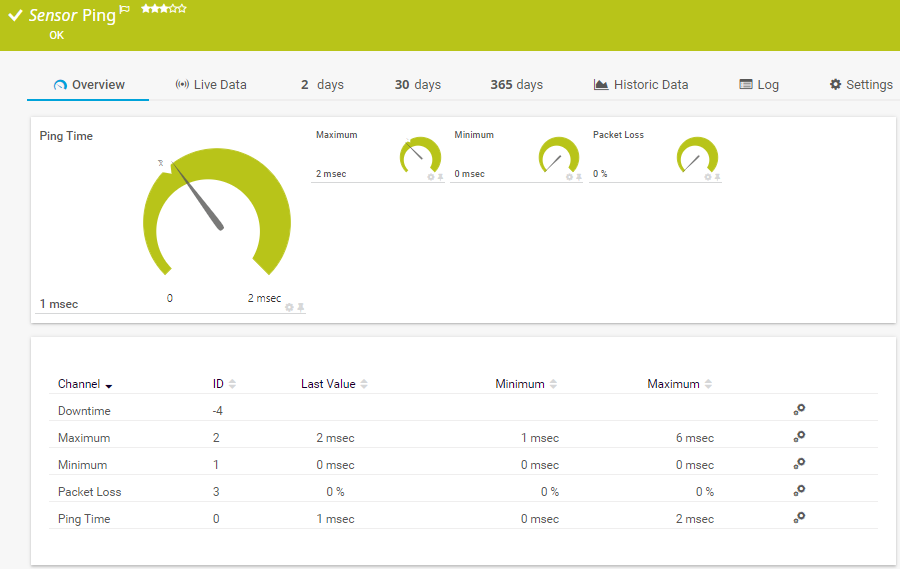
Your whole network at a glance
– even on the go

PRTG can be started within minutes and it's compatible with many mobile devices.

Download PRTG Network Monitor Manual in English

Download PRTG Network Monitor factsheet in English

PRTG monitors these vendors and applications, and more, in one view!

Monitor everything!

Thanks to PRTG you can monitor everything in your infrastructure including LANs, WANs, servers, websites, applications and much more.

PRTG monitors these vendors and applications, and more, in one view!

More

I particularly like having breakfast at home and just surveying my domain, and understanding what's working and what isn't.

Steve Coppin

Oxford University – More successful customer stories >>

We simplify your daily work!

Network autodiscovery

PRTG can scan network segments by pinging defined IP ranges. This way PRTG will automatically recognize a wide range of devices and systems and create sensors from predefined device templates. This saves you a lot of configuration work and you can start monitoring right away.

Maps

With PRTG Maps you can create web pages with up-to-date monitoring data in your desired design. You can even make maps with your monitoring data publicly available. Have an eye on your network like you need it!

Alerts

PRTG alerts you when it discovers warnings or unusual metrics. With our free Apps for Android, iOS, and Windows Phone you can get push notifications directly to your phone. You can easily setup notifications via email or SMS according to your needs. With our powerful API you can even write your own notification scripts.

Here's what monitoring looks like in PRTG

Status of all devices and applications at a glance

Create individual graphical maps

All server features at a glance

Web browser based UI of PRTG

Trusted every day by 200,000 admins around the globe

Administrators rely on PRTG Network Monitor to monitor their LANs, WANs, servers, websites, appliances, URLs, and more

Network problems create business emergencies. When the network goes down, employees can't read emails. Customers can't purchase the product. Work stops. Network monitoring helps you keep your business healthy:

  • Avoid expensive outages
  • Address bottlenecks before they cause problems
  • Reduce costs by buying only the hardware you need

Stop wasting time putting out fires. Start building the future foundations of your business. You'll be less stressed and your colleagues will consider you a hero.

Are you ready to move to the cloud?

  • Ready-to-use monitoring tool
  • Zero stress through automation
  • Scale as you grow, pay as you go

You want all the qualities of our great monitoring tool PRTG, but without having to maintain the system and manage the hosting yourself?

We're happy to announce the launch of our new cloud solution: PRTG hosted by Paessler, which can be set up in a matter of minutes. You'll benefit from automatic software updates and will be able to scale capacity up or down quickly thanks to our flexible subscription pricing. Ready to dive in yourself?

Try the Hosted Version of PRTG Now

Bandwidth monitoring: Find out who Is using your network, for what

PRTG Network Monitor runs on a Windows machine within your network, collecting various statistics from the machines, software, and devices which you designate. (It can also autodiscover them, helping you map out your network.) It also retains the data so you can see historical performance, helping you react to changes.

PRTG comes with an easy-to-use web interface with point-and-click configuration. You can easily share data from it with non-technical colleagues and customers, including via live graphs and custom reports. This will let you plan for network expansion, see what applications are using most of your connection, and make sure that no one is hogging the entire network just to torrent videos.

PRTG can collect data for almost anything of interest on your LAN. It supports multiple protocols for collecting this data:

  • SNMP and WMI
  • Packet Sniffing
  • NetFlow, IPFIX, jFlow, and sFlow

Firewall traffic monitored by PRTG

Monitoring results of a Ping sensor (shows the Ping times of a cloud server measured from 5 locations around the world)

Knowing when things break is good. Knowing before they break is even better.

PRTG Network Monitor includes more than 200 sensor types for all common network services, including HTTP, SMTP/POP3 (email), FTP, etc. But what is a sensor? One sensor within PRTG is one aspect that you monitor on a device. For example a specific URL, the traffic of a network connection, a port of a switch or the CPU load on a machine. Please have a look at the list of supported sensor types. Every entry in this list counts as one sensor. Normally, we are calculating with between 5 and 10 sensors per device, but of course that depends on what exactly you want to monitor.

We can alert you to outages before your users even notice them, including via email, SMS, or pager. Even better, after you use PRTG to track request times and uptime for a few months, you can optimize your network so your smartphone never gets a push from PRTG again. PRTG can print reports showing how good a job you are doing. (Tell your boss that your 100% uptime last quarter deserves a raise. We'll even print you the report to do it with.)

Most administrators want to test a tool for free before deciding to make an investment.

The many advantages of PRTG:

1. Free trial version: Take the time to explore PRTG so you can determine if it satisfies your needs and meets your expectations. Once the trial is over, it’s easy to upgrade your already configured version of PRTG, which means you’re much less likely to make an incorrect purchase.

2. One tool, one overview: Administrators often use a variety of monitoring solutions for their network or for the individual components of their infrastructure. But using several different tools every time you want to create an overview costs time and energy. PRTG is an “all-in-one” solution. Our dashboard and app provide a comprehensive overview, whenever you want it.

3. Quick customer support: Got a question? Stuck on a problem and need a hand? PRTG is backed by a dedicated development and support team. We do our utmost to answer every customer inquiry within 24 hours (on business days). Browse all our support topics here.

Configure your PRTG today. The trial version is free of charge. Save time, worry, and money with our monitoring tool designed for your network and entire infrastructure.

PAESSLER AG – German quality engineering

Free Download
  • Unlimited version of PRTG for 30 days
  • After 30 days, PRTG reverts to a free version
  • Or, you can upgrade to a paid license anytime

Get In Touch With Us

Complete the below fields to contact us.